
Banking book risk and benchmarks…

The textbook definition of commercial and retail banks is one where the loans that the bank extends to its clients is funded by the deposits from their current account holders.
These deposits take shape as checking accounts, money market accounts and time deposits. Except for time deposits, bank customers can withdraw their cash at any time, so no surprise these deposits are called “on demand deposits”.
Loans, on the other hand, are usually committed over fixed periods that can go from weeks/months (retail loans when someone buys a TV or a phone) to decades (on mortgage loans). Rates can be fixed or floating and sometimes there are prepayment charges.
Banks’ lending at higher rates than it pays on its deposits is a very important – if not the most important – source of profit for commercial and retail banks. That is very clear when you look at income statements at the “Net Interest Income” line. It follows that the more cash a bank has deposited, the more it can lend out, and the more they lend out of cash they have in hand, the better. But bank treasurers need to have enough cash to give to the depositors if they ask for it, so optimizing how much to lend out is key.
Banks use different types of features to attract deposits and make them sticky – from paying higher interest rates, paying premium rates if clients do not withdraw any money in that month, or offer CDs and other forms of time deposits where clients can only get their money after a fixed period.
It is important to note that while most deposits pay floating rates on the balances, borrowers might have their loans based on fixed rates. If overnight rates move higher the bank might need to pay to its depositors’ rates that are higher than what it is lending on long terms loans, exposing the bank to losses. Of course, the bank can decide not to pay higher rates to its depositors, which will cause its clients to move money to other banks that pay higher rates, draining cash from the bank and exposing it to a liquidity event.
On the loan side, there is the risk that borrowers will be unwilling or unable to repay the loans. Banks create tiers of borrowers – based on their probability of clients not paying back their loans – and charge higher or lower interest rates, so the excess interest paid will cover the losses on defaults for that tier of clients. In simple terms, if a certain tier of borrowers the bank has a 2% default rate a year, then if it charges 2% more interest on clients of this tier, than the losses will be covered by the additional interest rate. If the bank bet on the default rate is wrong and defaults are higher, then the bank’s profitability will be impacted…
This rather simplistic description of the business of commercial and retail banking can be boiled down to three fundamental risks then:
-
Depositors can take their money out at any time, while borrowers only need to repay their loans at a future date. If depositors ask for more money back than what the bank has available, the bank will become insolvent.
-
Higher short term rates vs the fixed long term loan rates can hurt bank profitability to dangerous levels.
-
If borrowers are unable to pay their loans, and the recovery process is unable to get the money back, the bank will suffer credit losses.
These risks are usually inversely correlated with profitability. If you lend more, for the same depositor base, you earn more interest, but you increase the risk of running out of cash at a point. If you lend very long term to a business and require no collateral, you will get a higher interest rate for the loan, but you increase the risk that you will not get paid back. So, lending very long term might get you more interest now, but might not be worth it.
The bank executives and treasurers need to navigate this difficult balance of risk and reward. They need to manage the size and maturity of their banking book balance sheet items not only for what might happen in the next weeks, but also for a window of years.
Unlike trading books, where banks can buy and sell financial instruments in liquid markets, loans and deposits has serious limitations if one wants to readjust the assets and liabilities. Loans can not be called at the bank’s convenience and depositors can withdraw the money at any time. One can say then that the banking book is naturally short convexity, or short optionality.
Managing the banking book is a difficult job that requires a lot of experience and diligence. No other business can go bankrupt if their all their clients just leave in one day…. If all clients ask their money back for any bank, that bank will go bankrupt, even if clients want to put all the money back the following week. If we all stop buying Coca-Cola for a week, Coca-Cola will not be insolvent.
Managing a banking book – the traditional approach
As the economy goes through the expansion and contraction cycles, people and businesses will react, with impact on deposits, defaults, and demand for loans. Expansion and contraction cycles can be represented by indicators, some easier to measure than others, helping represent the state of the economy, which will have an impact on people’s behaviours. This impact is difficult to measure as well, and almost impossible to define at the individual level. How would a 5% increase in fuel prices impact the ability of Joe to pay his car loan?
Trying not to state the obvious, the behaviour of depositors and borrowers are key drivers for the banks business. These economic agents are influenced by macro and microeconomic, regional, and other factors. Employment levels, inflation, capacity utilization, consumer sentiment, commodity prices, regional economic activity, etc., will impact banks’ balance sheet items as they represent the state of the economy, and depositors and borrowers will change their behaviour if the economic conditions change.
Fortunately, the behaviour of groups of individuals is easier to predict, so banks rely on certain assumptions on how their balance sheet items will behave in different economic conditions. They use this to manage the delicate balance between profitability and risk, positioning the business between holding all its deposits in cash (losing money) versus bank lending all its money (running liquidity and credit risk).
Bank executives and treasurers have relied for decades on experience to manage assets and liabilities, while regulators have use KPIs to control excessive risks and disruptions of the banking system. But even if you can predict the future state of the economy, you will need to predict the behaviour of the economic agents as well and the impact on the balance sheet, which makes the job extremely challenging.
This traditional approach has helped the banking system navigate several crises, but not without some collateral damage. And sometimes very large collateral damage.
Benchmarking banks
As regulated entities, banks are required to publish a lot of information about their balance sheet. This data goes back decades and can provide good insights on where the unknown risks might be. In the past, getting all that data can be a challenge, but technology has come a long way.
Jabuticaba.app, relying on the extensive experience of working with banks and our AI based data extraction capabilities, we have sourced relevant data. We have then run our KPIs for all the banks in the US and got some telling results.
One example is the Jabuticaba Short Term Liquidity Index (STLI), where we rely on balance sheet data going as far back as 1990 to create a ratio between short term (maturing in the next year) liabilities (demand deposits, term deposits maturing under a year) and assets (cash, loans maturing under a year) so we can compare what banks are best positioned if depositors withdraw their money.
More specifically,

[short term assets] = cash + [short term securities] + [short term loans]
[short term liabilities] = [demand deposits] + [short term time deposits] + [money market accounts] + [other short term deposits]
A ratio of 4 would mean that the bank can cover a run of 25% on its deposit base.
It important to note that the Liquidity Index is a bit different then LCR (Liquidity Coverage Ratio) as defined by Basel III. One main difference is that it does not include securities, in particular Treasuries and MBS, which could be sold or repo ’ed to get access to cash. While we have that information, the objective is to assess the ability of the bank to withstand a liquidity shock in the next 12 months without necessarily changing its operating model. Bank executives should see JBLI as an additional KPI.

We considered banks between $5bi and $15bi in assets as reported in September 2023. The US has over 150 banks with a median STLI of 5.6, which means that short term assets are 17% of their liabilities, what is not far from what anecdotally we get as a reasonable level when talking to bank treasurers.
The Pareto graph on Figure 1. bellow shows the distribution of the banks per STLI, where the Y axis shows the number of banks on the ranges of the Liquidity Index.
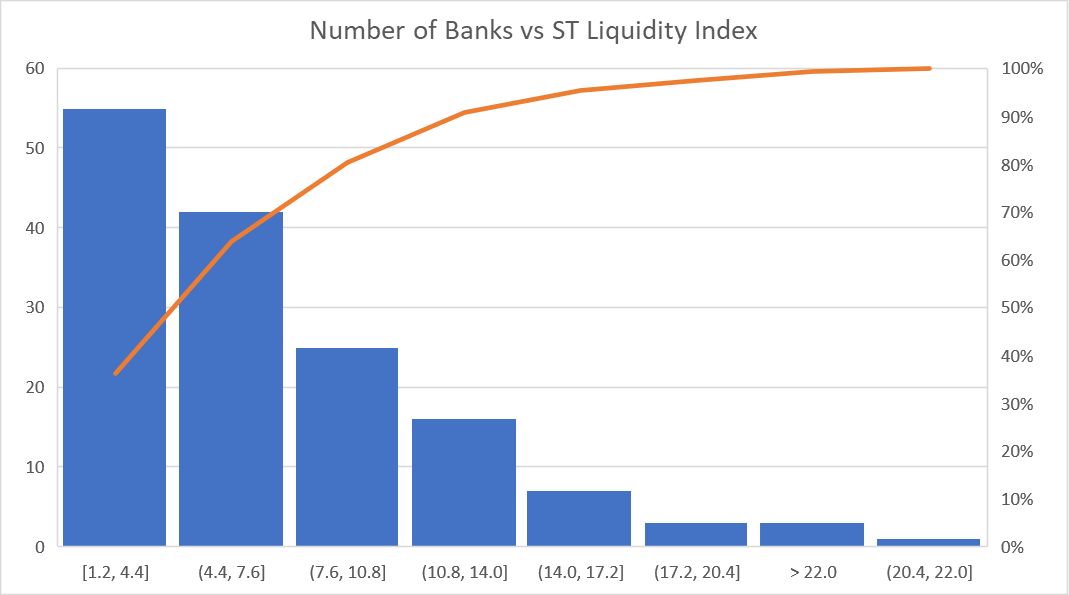
Figure 1. Pareto distribution of the STLI
About 80% of the banks have a STLI under 10, with only 5% over 12.5 and less than 2% over 20.
The distribution of the liquidity index is uniform across US regions (except New England where there are some banks with a rather high STLI) as you can see on the table below.

Making sense of lots of data
So, while the STLI by itself is probably not enough for someone to decide if a bank is in a better situation than another, it gives an idea where those banks stand vs its peers. Other ratios indexes and Profitability Ratios would help assess the ranking best and can help us get a good view of the banking landscape in the Americas. By getting data from banks in other countries, we can compare and assess their balance sheets.
We are very happy to say that leveraging on our decades of experience in banks and technology, Jabuticaba can provide, today, very insightful data on how a bank benchmarks to its peers, with robust data and using ratios and indexes, with little to no commitment of time from the bank’s IT or operations.
Find Out Where You Stand
One can say that understanding your position relative to industry benchmarks is not just beneficial—it's essential. Are you confident in your bank's current standing and future direction? Have you considered the potential cost of not knowing exactly where you fit in the competitive landscape?
We invite you to explore this crucial aspect with us. Our benchmarking service is designed to provide you with a clear, comprehensive view of your bank's performance in key areas. This isn't just about numbers; it's about gaining insights that could be pivotal in shaping your strategic decisions.
By choosing to benchmark with us, you'll be able to:
Assess Your Competitive Edge: Understand how your bank compares to peers.
Identify Opportunities for Improvement: Pinpoint areas where your bank can enhance performance and operational efficiency.
Strategize with Confidence: Make informed decisions based on data-driven insights.
Can you afford to operate without this crucial knowledge?
Let's uncover the answers together. Reach out to us, and let's begin this vital exploration into your bank's performance.
Next step: stressing out the balance sheet.
On our next blog, we will share how we are using historical macro-economic data to model the balance sheet items, leveraging AI and big data, so we can support bank executives on projecting their balance sheets and be on the lookout for unknown risks.